Securing a commercial location is only the first step toward building a profitable vending machine business. Long-term performance depends on carefully evaluating foot traffic, understanding pedestrian dwell time, and estimating purchase conversion rates. New operators often make the costly mistake of treating high foot traffic as guaranteed sales. A smart vending machine placed in a busy transit corridor may attract thousands of passersby but generate disappointing sales, while the same machine in an industrial breakroom or hospital waiting area may benefit from more consistent purchasing opportunities.
To reduce guesswork and avoid investing in underperforming locations, vending machine operators need a structured, data-driven evaluation process. This guide explains how to measure pedestrian volume, assess capture rates across different commercial environments, account for seasonal and weekly traffic variations, and forecast sales before signing a placement agreement.
Comparative Assessment of Foot Traffic Across Core Commercial Locations
Not all foot traffic has the same commercial value. A useful location assessment considers pedestrian volume, movement speed, dwell time, purchase intent, and the availability of alternative food and beverage options.
| Property Type | Indicative Daily Foot Traffic or Population | Typical Dwell Time | Illustrative Conversion Rate | Key Traffic Characteristics |
|---|---|---|---|---|
| Manufacturing facilities and warehouses | 100–300 employees | 15–30 minutes during breaks | 15%–25% | Repeat customers and predictable break schedules |
| Call centers and technology parks | 200–600 employees | 8–10-hour shifts on-site | 8%–14% | Potential demand for energy drinks, coffee, and snacks |
| Hospital waiting areas | 300–1,000+ people daily | 45–120+ minutes | 4%–8% | Longer waits and demand for convenient refreshments |
| Residential lobbies and apartments | 150–400 residents | 1–3 minutes passing through | 3%–6% | Convenience purchases, including evening and impulse demand |
| Transit hubs and subway stations | 2,000–10,000+ passersby | Often less than 1 minute | 0.5%–1.5% | High volume but potentially limited purchase time |
Note: These figures are illustrative planning benchmarks from the original draft, not universal industry averages. The population, dwell-time, and conversion-rate figures use different measurement bases and should be validated against actual site data before being used in a financial forecast.
1. How to Measure Foot Traffic and Evaluate Conversion Rates
A reliable revenue projection starts by distinguishing total building occupancy from the number of people who actually pass the proposed machine location. Property managers may report total employees, residents, or visitors, but those figures do not necessarily represent the number of potential customers who can see and access the machine.
Understanding the Three-Stage Foot Traffic Conversion Funnel
A practical evaluation framework separates pedestrian traffic into three stages:
Stage 1: Total Passerby Foot Traffic
This is the number of pedestrians walking within an approximately 30-foot visual radius of the proposed machine location during a defined period. The measurement should focus on the relevant area rather than the entire building.
Stage 2: Engaged Foot Traffic (Capture Ratio)
This represents pedestrians who slow down, notice the machine, examine the product display, or approach the payment interface. The original planning model uses an indicative engagement range of 10%–30% of total passerby traffic.
Stage 3: Converted Foot Traffic (Completed Transactions)
This represents engaged visitors who complete a paid transaction. The original model uses an indicative conversion range of 20%–50% of engaged visitors.
These ranges are planning assumptions, not guaranteed outcomes. Actual engagement and purchase rates depend on the location, customer needs, product selection, prices, visibility, payment options, and competing retailers.
For example, in a high-speed subway concourse, the engagement ratio may fall below 5% because many commuters are focused on catching their trains. In an employee breakroom, the engagement ratio may exceed 35% when workers have time to stop and purchase refreshments. These figures should be tested through on-site observation rather than assumed for every location.
The funnel helps operators identify where potential sales are being lost. A machine may be visible to many people but offer products that do not match their needs. Alternatively, the product range may be suitable, but poor placement or an inconvenient payment process may discourage purchases.
Multi-Channel Foot Traffic Data Collection
Professional operators can combine manual observation with suitable traffic-counting tools to build a more reliable picture of pedestrian activity.
Structured manual counts
Conduct repeated 15-minute pedestrian counts during different operating windows, including morning entry, midday lunch, and afternoon breaks. Multiplying a 15-minute count by four gives a preliminary hourly estimate, but the estimate should be checked against additional time periods because traffic is rarely uniform throughout the day.
Optical and infrared counters
Where permitted, temporary optical sensors or infrared beam counters can measure traffic patterns near narrow corridors and other defined passageways. Longer monitoring periods can reveal hourly peaks, nighttime declines, and differences between weekdays and weekends.
Anonymized mobile-location analytics
Aggregated location analytics may help operators understand broader patterns, such as seasonal occupancy changes, differences between weekdays and weekends, and the movement of repeat visitors. Before relying on such data, confirm the provider’s methodology, geographic coverage, privacy practices, and the distinction between unique visitors and repeat visits.
On-site observation
Observe whether people slow down, stop, gather, or pass through quickly. Record nearby queues, seating, doors, obstructions, and competing services. These observations can help explain why a location with high total traffic may still produce limited sales.
Time-Window Auditing and Seasonal Adjustments
A single traffic count on a Tuesday morning or a sunny Friday afternoon may create significant sampling bias. Commercial and industrial traffic can change with shift schedules, remote-work policies, school calendars, holidays, and seasonal operating patterns.
For an initial audit, consider three daily observation windows:
Morning shift window: 7:00 AM–9:00 AM. Assess potential demand for breakfast items, coffee, and hot beverages.
Midday lunch window: 11:30 AM–1:30 PM. Evaluate demand for cold drinks, snacks, and meal replacements.
Afternoon window: 2:30 PM–4:00 PM. Observe potential demand for energy drinks and afternoon snacks.
Adjust these periods to match the actual facility schedule. A warehouse with overnight shifts or a transit hub with late-night traffic may require a different observation plan.
Seasonality also matters. As an illustrative planning assumption, an office location audited during October might experience a 30% reduction in daily traffic during July and August because of summer vacations. University locations may experience traffic approaching zero during semester breaks, while manufacturing facilities may close temporarily for annual maintenance.
The 30% reduction is an example, not a universal seasonal rate. Operators should use historical occupancy records, facility calendars, and repeated observations to estimate a realistic seasonal adjustment for each location.
2. Quantitative Revenue Forecasting: Calculating Location Potential
Once pedestrian volume and conversion assumptions have been established, operators can use a consistent formula to estimate potential gross sales.
The Revenue Projection Formula
Projected Monthly Gross Sales = Daily Eligible Foot Traffic × Purchase Conversion Rate × Average Order Value (AOV) × Operating Days × Seasonality Index
Where:
Daily eligible foot traffic is the number of people with a realistic opportunity to see and use the machine.
Purchase conversion rate is the percentage of eligible visitors expected to complete a transaction.
Average order value (AOV) is the average amount spent per transaction.
Operating days is the number of days the machine is expected to be available for sales.
Seasonality index adjusts the forecast for seasonal changes. A value of 1.0 means no adjustment; a value of 0.7 represents a 30% reduction.
For a more accurate model, distinguish total passersby from the people who can actually access the machine. If the conversion rate is calculated from eligible traffic, do not apply an additional engagement ratio to the same figure, as this would count the traffic reduction twice.
The formula estimates gross sales, not net profit. A complete financial analysis should also account for product costs, payment processing fees, commissions or rent, electricity, connectivity, restocking labor, maintenance, refunds, spoilage, insurance, and other operating expenses.
Scenario A: High-Intent Industrial Distribution Center
Consider an industrial fulfillment center with 250 shift workers operating 22 days per month. The facility has a closed-campus policy, workers have a strict 15-minute break allowance, and employees cannot easily leave the premises to purchase refreshments.
For this illustrative model, assume a 16% purchase conversion rate, an average order value of $2.60, and a seasonality index of 1.0.
Daily completed transactions:
250 workers × 16% conversion = 40 purchases per day
Monthly gross sales:
40 transactions × $2.60 AOV × 22 days × 1.0 = $2,288.00
This example assumes that all 250 workers are eligible potential customers. In an actual site audit, operators should adjust the figure if only some employees pass the machine, use the breakroom, or work on a given day.
Scenario B: High-Volume Commercial Transit Corridor
Now consider a subway station corridor with 4,500 daily passersby and 30 operating days per month. Many pedestrians are moving quickly to catch trains, and nearby coffee shops and convenience stores provide alternative purchasing options.
For this illustrative model, assume a 0.6% purchase conversion rate, an average order value of $1.90, and a seasonality index of 1.0.
Daily completed transactions:
4,500 passersby × 0.6% conversion = 27 purchases per day
Monthly gross sales:
27 transactions × $1.90 AOV × 30 days × 1.0 = $1,539.00
The transit corridor records 18 times the raw foot traffic of the industrial facility, yet its modeled monthly gross sales are approximately 32.7% lower than the warehouse scenario.
This comparison illustrates why total foot traffic alone is insufficient for location selection. The result depends on the assumed conversion rate, average order value, eligible audience, and operating schedule. Both examples are hypothetical scenarios, not verified earnings projections or universal benchmarks.
Compare Conservative, Expected, and High-Demand Scenarios
Before signing a location agreement, calculate at least three sales scenarios. Change assumptions such as eligible visitors, conversion rate, average order value, and operating days to see how sensitive the forecast is.
A site that appears attractive only under the most optimistic assumptions may carry significant risk. A location with lower but more predictable traffic, repeat customers, and lower operating costs may offer a more sustainable business opportunity.
3. Five Micro-Location Factors That Can Influence Sales Conversion
Even a building with substantial foot traffic and strong customer demand can underperform if the machine is installed in the wrong place. During a site audit, assess the exact installation area rather than relying on the building’s overall visitor numbers.
1. Line-of-Sight Visibility
A vending machine should be easy to notice from the natural direction of pedestrian movement. Structural columns, signs, doors, furniture, and other obstructions can hide the product display or payment interface.
The original planning model suggests that clear visibility from 20 feet or more may improve the opportunity for impulse purchases, with a potential increase of up to 45% under favorable conditions. This figure should be treated as a claim to validate through site-specific testing, not as a guaranteed uplift.
When evaluating a location, check whether approaching pedestrians can see the machine in time to decide whether to stop. Also consider lighting, display brightness, and whether signage is permitted.
2. Pedestrian Speed and Natural Stopping Zones
The speed at which pedestrians move through a space can affect their willingness to stop and interact with a vending machine. Fast-moving corridors, such as transit walkways and main entrances, may offer limited opportunities for browsing.
The original draft identifies corridors with pedestrian speeds above 3 mph as potentially challenging for customer capture. By contrast, breakrooms, elevator waiting areas, and reception lounges may offer more natural opportunities to pause.
Treat 3 mph as an observation reference rather than a universal cutoff. Customer behavior also depends on the reason for visiting the area, available time, and whether stopping would obstruct other people.
3. Proximity to Seating and Rest Areas
Placing a machine within approximately 10–15 feet of tables, lounge chairs, or breakroom seating may make it easier for people to purchase and consume products.
When customers sit down to rest, make a phone call, or eat lunch, they may have more time to notice the machine and consider additional items. This can create opportunities for multi-item purchases and potentially increase average order value.
The original draft associates placement within about 15 feet of breakroom seating with stronger multi-item purchasing behavior. Operators should verify the effect through actual sales data rather than assuming that distance alone will produce a specific increase.
4. Ambient Lighting, Appearance, and Security
Consumers may feel more comfortable purchasing from a machine in a clean, well-lit, visible area. Poor lighting, secluded corridors, and inconvenient after-hours access may discourage use and increase security concerns.
Check whether the machine is visible from occupied areas, whether customers can use the payment terminal comfortably, and whether the property has requirements for lighting, cameras, and access control. Any monitoring equipment should comply with applicable privacy requirements and facility policies.
5. Proximity to Competing Food and Beverage Outlets
Nearby cafeterias, convenience stores, coffee bars, and other food services can affect vending machine demand. Competition is particularly relevant when alternatives are cheaper, better stocked, or easier to reach.
The original planning matrix suggests that competing food outlets within a two-minute walk may reduce vending conversion by 40%–60% in some circumstances. This is a substantial claimed effect and should be validated for the target site; it should not be treated as a universal rule.
Rather than rejecting every location with nearby competition, compare the products, prices, opening hours, and walking distance of alternative providers. A vending machine may still serve customers who need access after regular business hours or want a product not offered nearby.
4. Comprehensive On-Site Vending Location Audit
To standardize location evaluation, complete the following five-part inspection before signing a placement agreement.
Step 1: Verify Pedestrian Volume
The original screening framework uses the following indicative thresholds:
Enclosed, captive venues such as offices and warehouses: At least 150 dedicated daily site personnel.
Open public venues such as hospitals and transit hubs: At least 1,200 daily passersby.
These thresholds can serve as initial screening criteria, but they do not guarantee profitability. A location’s product demand, eligible customer count, average spending, rent, commission, and service costs must also be evaluated.
Step 2: Assess the Capture Zone and Pedestrian Speed
Check whether the proposed machine position is in a natural stopping area rather than a high-speed passageway. Where practical, orient the machine interface toward approaching pedestrians so the display is easy to see.
Step 3: Check Main Pedestrian Routes
Confirm that the machine is positioned along relevant daily movement routes, such as the path between work areas and breakrooms, employee exits, restrooms, or water stations. Do not obstruct emergency exits, accessible paths, or required circulation space.
Step 4: Map Nearby Competitors
Walk through the surrounding area and identify vending machines, micro-markets, cafeterias, convenience stores, and other food services within approximately 300 feet of walking distance.
Record the actual route, opening hours, product range, and pricing. The absence of nearby competitors may be advantageous, but the presence of competitors does not automatically make a location unsuitable.
Step 5: Verify Operating Hours and Seasonal Patterns
Confirm whether the facility operates 24 hours a day, closes on weekends, or experiences lower traffic during holidays and seasonal shutdowns. Use the facility calendar and available historical data to adjust the annual sales forecast.
5. Improving Location Performance with Zhigou Technology Vending Machines
A thorough foot traffic audit helps operators identify promising locations. The machine’s product presentation, payment experience, and suitability for the site can also influence whether interested pedestrians complete a purchase.
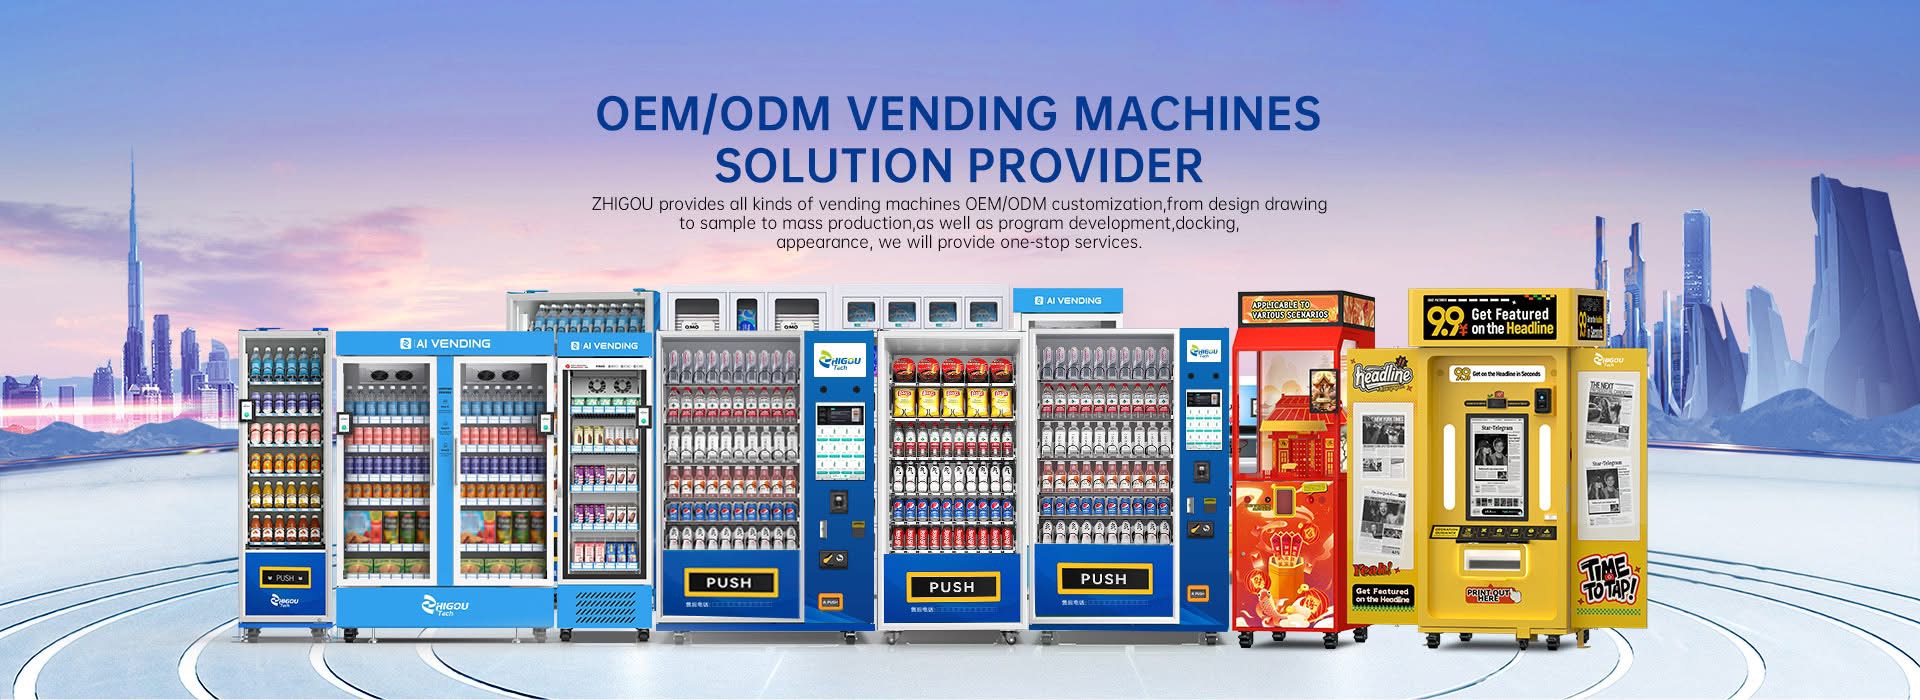
Zhigou Technology supplies vending machine solutions for different retail environments, including spiral vending machines and AI vision-based smart vending cabinets. Depending on the model and configuration, features may include high-definition touchscreens, refrigerated storage, LED lighting, cashless payment integration, and remote management functions.
For example, a refrigerated model may suit locations selling chilled drinks or food, while flexible product lanes may be useful for merchandise with different package sizes. Cashless payment options may also be important in locations where customers commonly use cards or mobile wallets.
The original draft refers to support for contactless credit cards, Apple Pay, Google Pay, and QR-code payments, as well as transaction processing in three seconds. These claims should be confirmed against the exact machine model, payment terminal, and service provider before publication. Payment methods and processing times can vary by configuration and deployment conditions.
Operators should match the machine’s capacity, product lanes, refrigeration, payment setup, and remote management functions to the actual site requirements. Equipment selection can support a better customer experience, but it cannot compensate for an unsuitable location or an unrealistic revenue forecast.
Frequently Asked Questions
What Is Considered a Strong Conversion Rate for a Vending Machine Location?
The original planning ranges suggest 8%–18% for captive environments such as manufacturing plants, call centers, and corporate offices, and 0.5%–4% for open public locations such as hospitals, residential lobbies, and transit centers.
These ranges are illustrative rather than universal benchmarks. Actual conversion rates depend on the denominator used, the eligible audience, product relevance, pricing, visibility, payment convenience, operating hours, and nearby alternatives. Operators should calculate conversion consistently and compare actual transactions over comparable periods.
How Many Daily Visitors Are Needed to Make a Vending Machine Profitable?
The original draft suggests 100–150 daily personnel for enclosed, captive facilities and 1,000–1,500 daily passersby for open public locations as preliminary screening figures.
These numbers do not establish profitability by themselves. Operators must also consider how many people can realistically use the machine, average order value, product margins, rent or commissions, operating costs, and service frequency.
How Much Can Machine Placement Within the Same Building Affect Sales?
The original draft states that placement can affect gross sales by more than 200%, and that moving a machine from a low-visibility basement corridor or secluded stairwell to a central, well-lit breakroom or elevator lobby may double or triple daily transactions.
These are substantial performance claims and should be supported with reliable source data or a clearly documented case study before being presented as established industry results. The practical takeaway remains that visibility, accessibility, pedestrian movement, and proximity to customer activity can influence performance.
How Should Operators Use Foot Traffic Data Before Signing a Contract?
Count relevant pedestrians at several times and on multiple days. Separate total passersby from eligible visitors, estimate conversion using a clearly defined denominator, and calculate sales under conservative, expected, and high-demand scenarios. Update the forecast once the machine has generated actual sales data.
Final Strategic Summary for Automated Retail Operators
Building a profitable vending machine route requires more than finding a location with high foot traffic. Operators should evaluate traffic quality, dwell time, customer needs, conversion rates, physical placement, seasonal changes, competing services, and the full cost of operating each machine.
A structured process combining repeated pedestrian counts, a three-stage conversion funnel, transparent revenue calculations, and a practical site audit can help operators compare locations and identify risks before signing a placement agreement.
Equipment selection should follow the same principle. Match the machine’s capacity, refrigeration, product lanes, payment configuration, and management features to the site’s conditions and intended merchandise.
No single traffic threshold or conversion rate can guarantee profitability. The strongest decisions combine measurable site data, realistic assumptions, actual sales performance, and an equipment configuration suited to the location.